
The United States now owes more than $40 trillion, and the price of lending to it has jumped at the same moment. Together these two facts point to a future in which a large and growing share of every federal budget goes to interest.
The yield surge in context
The US 10-year Treasury yield stands near 5.22% 5.25%. It has climbed almost half a percentage point in a month and about 1.07 points since January. The 30-year yield has been trading above 5.5%, levels not seen in more than twenty years.
This is not only an American event. The UK and Australia both sit near 5.38%, Germany is at 3.61%, Japan at 3.10% and India at 7.17%. The table below shows how policy rates, yields and inflation line up. Real yield is simply the 10-year yield minus the latest inflation reading.
| Economy | Policy rate (%) | 10-year yield (%) | Inflation (%) | Real yield (%) |
|---|---|---|---|---|
| United States | 3.75-4.00 | 5.24 | 3.4 | 1.84 |
| United Kingdom | 3.75 | 5.38 | 3.1 | 2.28 |
| Australia | 4.60 | 5.38 | 3.5 | 1.88 |
| Euro area | 2.65 | 4.07 | 3.2 | 0.87 |
| Japan | 1.25 | 3.10 | 1.9 | 1.20 |
| India | 5.25 | 7.17 | 4.82 | 2.35 |

Why yields are high prices and central banks
Two forces explain the immediate jump. The first is an energy-led rise in the cost of living. Brent crude trades around $96 a barrel, up about 58% this year. Heating oil has more than doubled, European gas is up roughly 145%, and Asian liquefied gas is up about 165%. Wheat is 36% higher, and fertiliser prices are rising too. When fuel and food get more expensive, inflation expectations climb, and lenders who accept fixed payments demand more compensation.

The second force is monetary policy. The Federal Reserve lifted its policy rate from 3.75% to 4.00% this month, and traders expect another increase at the end of October. Japan, the euro area and Australia have also tightened. When investors expect short-term rates to stay high, they will not lend for ten or thirty years at low returns.
The $40 trillion problem
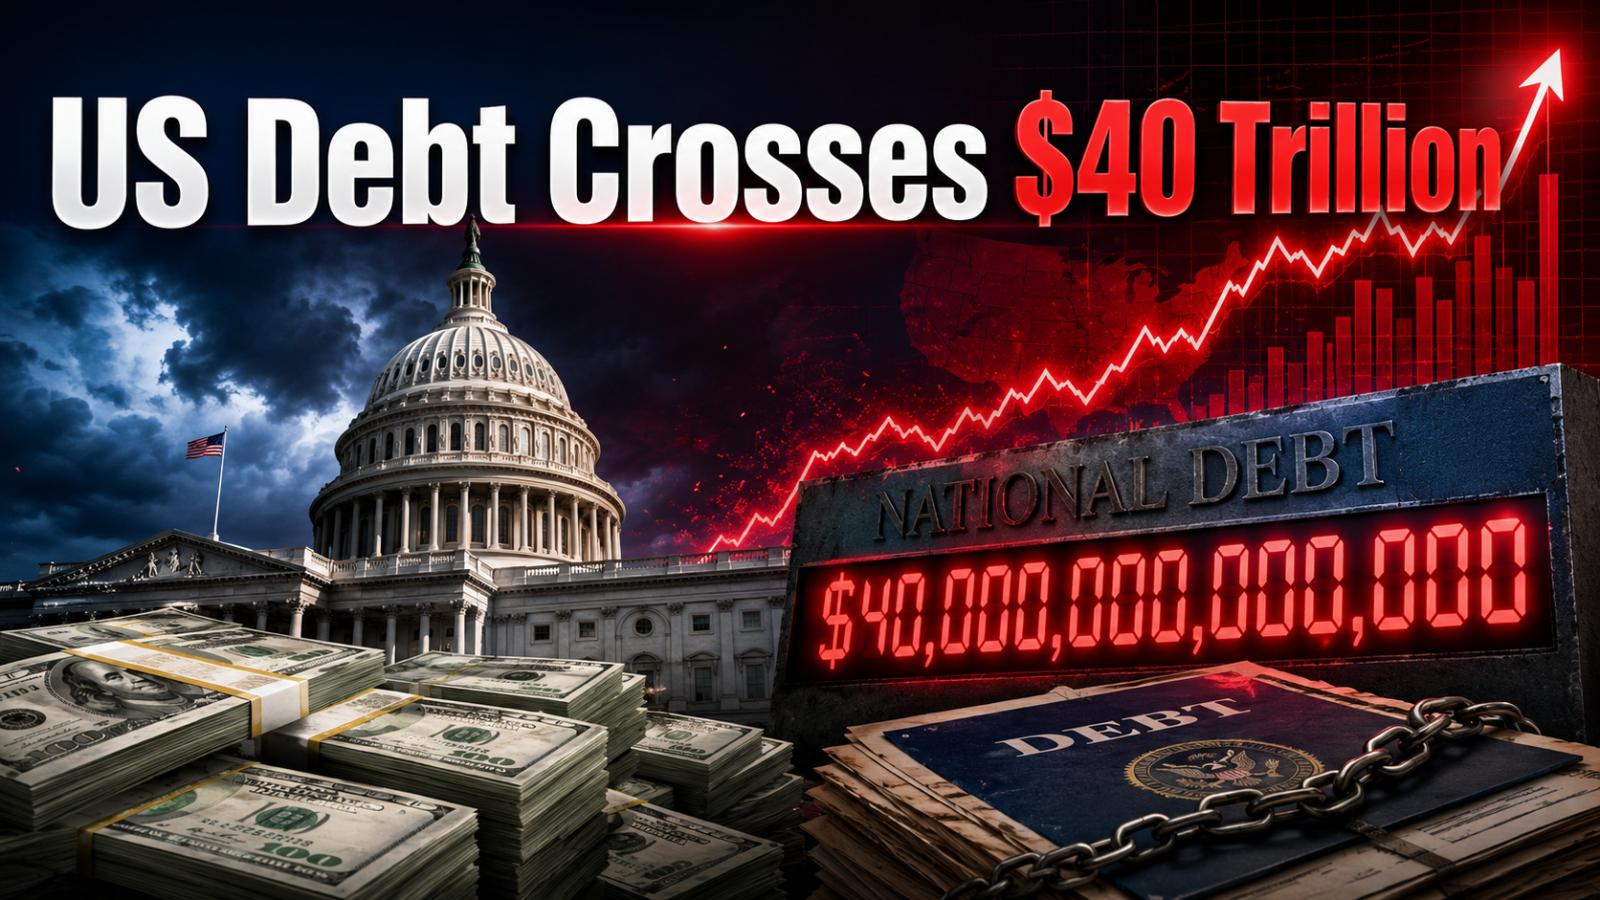
Behind these cyclical pressures sits a structural one. US gross national debt crossed $40 trillion in mid-August 2026. It passed $39 trillion only about five months earlier, and it has roughly doubled in a decade. Of the total, around $32.4 trillion is held by the public, meaning investors at home and abroad. The remaining $7.7 trillion is owed by one part of the government to its own trust funds.
Some numbers put the scale in perspective:
- The debt equals about 1.2 times a year of national economic output.
- It works out to about $117,000 for every American.
- It is rising by nearly $7 billion a day.
- Projections from the Congressional Budget Office point to about $43 trillion by the end of fiscal 2028.
The reason is a persistent gap between revenue and spending. For this fiscal year, the government expects to collect about $5.6 trillion and spend about $7.4 trillion, leaving a deficit near $1.9 trillion. Every dollar of that gap must be borrowed by selling more Treasury securities.
The interest trap why interest is becoming the main event
Here is the part that matters most for the future. Interest on the debt is no longer a background item. Net interest passed $1 trillion for the first time in fiscal 2025, at about $1.03 trillion. This year it is expected to take roughly 14% of all federal outlays, which is more than the country spends on defence. Among individual budget lines, only Social Security is larger.
Several mechanics make this worse over time.
Old, cheap debt is rolling over into new, expensive debt. The average interest rate on all marketable Treasury debt is about 3.5%, compared with roughly 1.5% five years ago. But a new 10-year bond today costs about 5.2%, and a 30-year bond over 5.5%. As older bonds issued at low rates mature, they are replaced at today’s higher rates. So the average cost of the debt keeps climbing even if market yields stop rising.
A simple illustration shows the size of the effect. With about $32 trillion held by the public, each one-point rise in the average interest rate adds roughly $320 billion a year in interest once fully in effect. If the average rate drifted from 3.5% up toward 5%, annual interest would approach $1.6 trillion, before counting any growth in the debt itself. This is my own rough arithmetic and ignores many details, but it shows the direction. Official projections already have net interest reaching about $2.1 trillion by 2036.
Interest is compounding. With a deficit near $1.9 trillion and interest costs above $1 trillion, roughly half of the annual borrowing is effectively going to pay for past borrowing. The government is, in part, borrowing to service its earlier borrowing.
Interest cannot be cut by a vote. Lawmakers can change defence budgets, benefit formulas and tax rates. They cannot decide to pay less interest on bonds that investors already own. It is a contractual obligation that grows automatically with debt and rates. At the current pace, interest already absorbs about 18 cents of every dollar of tax revenue.
So does the US “only pay interest” in the future? Not literally. Social Security, healthcare, defence and other programmes will continue. But if the trend holds, interest becomes the fastest-growing and least flexible part of the budget. Either it squeezes out other spending, or it forces higher taxes, or it leads to still larger deficits and still more borrowing. That is what people mean by a debt spiral: rising debt lifts interest costs, which widen deficits, which add to debt.
How debt and yields feed each other
The relationship between the debt and yields runs in both directions. A larger debt means more bonds must be sold each year. When supply increases faster than demand, prices fall and yields rise. Investors also ask for an extra premium to hold long-term US debt when they worry about deficits and inflation. That premium raises the government’s own borrowing costs, which raises the deficit, which requires more issuance.
The US is not in danger of running out of dollars, because it borrows in its own currency, and demand for Treasuries remains deep. An ordinary default is very unlikely. The real risks are different. Persistently high deficits can keep inflation elevated, weaken confidence in the dollar over time, and push up borrowing costs across the economy. Mortgage rates near 7% and higher rates on business and car loans are already visible signs.
The global spillover
Because Treasuries are the world’s benchmark safe asset, their yields set the floor for borrowing costs almost everywhere. When Washington pays more, other governments must offer more to compete for the same global savings. India illustrates this. Its 10-year yield is up about 0.60 points this year, less than the US rise, so the gap between the two has narrowed by roughly half a point. Even so, India’s yield is about 1.9 points above America’s, and its inflation of 4.82% keeps real returns high. As an oil importer facing dearer crude and higher subsidy costs, India feels pressure from both global rates and its own budget.
What could break the cycle
There is no painless exit, but several forces could ease the strain:
- Lower oil prices. If Middle East tensions ease and crude falls, inflation expectations could cool and yields could retreat.
- Smaller deficits. Some combination of spending restraint and higher revenue would slow new borrowing. This is politically hard, since the largest budget items are also the most popular.
- Stronger growth. A faster-growing economy raises tax revenue and makes a given debt easier to carry.
- Debt management. The Treasury can lean more on short-term bills to limit long-term yields, although that raises refinancing risk when rates are high.
- Cooling inflation. If prices moderate, the Fed can hold or cut rates, which reduces short-term borrowing costs.
The combination is uncomfortable. Elevated yields are the market’s response to rising prices, tight central banks and a mountain of government debt that keeps growing. Because the average interest rate on the debt is still below current market yields, the bill will keep rising as bonds are refinanced. That makes the trajectory of the US budget one of the defining economic questions of the coming decade: whether interest remains one large expense among many, or becomes the item that dictates every other choice.
Notes: Bond yields, policy rates, inflation and commodity figures are from Trading Economics as of 30 September 2026 (inflation is each country’s latest reading; UK inflation is approximate).

Leave a Reply